This is an EDA Sample Project on the India geographical dataset of COVID-19.
Problem Definition for COVID-19 EDA Sample Project:
- Analyze the association between the number of doses taken and the number of deaths in each state.
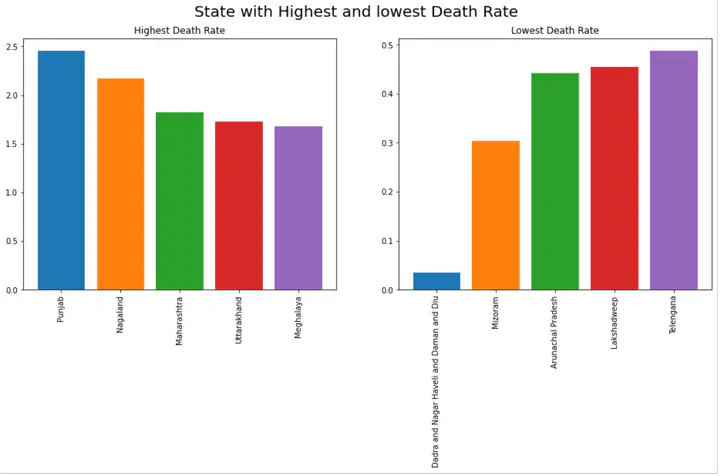
- Calculate the growth rate of confirmed cases and death rate by state.
- Calculate the distribution of doses among the population of each state.
- Compare the population of each state based on the different doses taken.
I followed complete workflow stages to complete the task in terms of data extraction and visualization for better understanding.
Workflow stages for COVID-19 EDA Project:
- Question or Problem Definition.
- Acquire training and testing data.
- Wrangle, prepare and cleanse the data(preprocessing and cleaning data).
- Analyze, identify patterns, and explore the data(Visualization and information extraction).
- Conclusion (Extracted information).
Earlier I learned about visualization with Seaborn. Along with that, I try to utilize those skills and
Collab notebook link: Link
Dataset link: Link
My Website link: https://www.ukant.tech
Ukant Jadia
Graduate | ML & Software Engineer
My research interests include applied machine learning, visualization, programming boring stuff.